Udenrigsudvalget 2016-17
URU Alm.del
Offentligt
1799009_0001.png
MEPC 71/INF.2
Annex, page 1
ANNEX
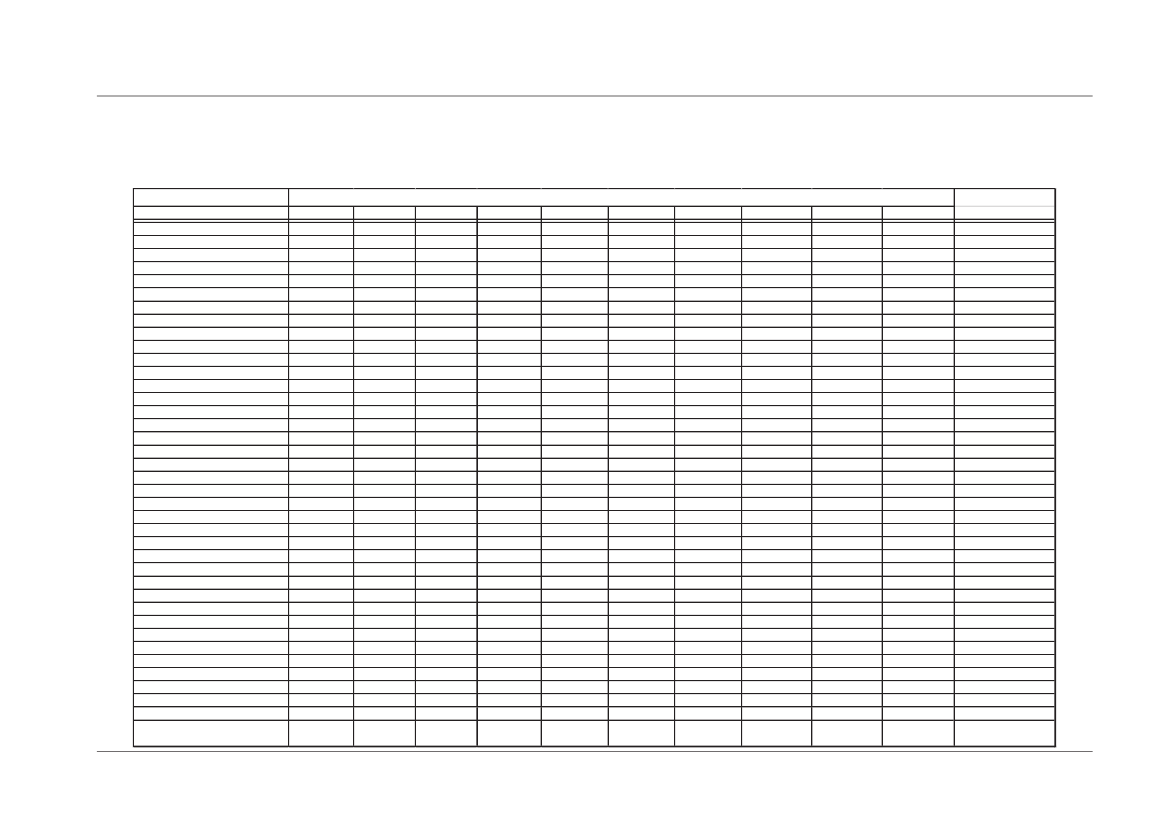
CONDITION FOR ENTRY INTO FORCE OF THE HONG KONG CONVENTION
Table 1: Annual ship recycling volume (2006
2015)
TABLE 1 : DETERMINATION OF ANNUAL SHIP RECYCLING VOLUME (Data by IHS Maritime & Trade)
RECYCLING STATE
Albania
Argentina
Australia
Azerbaijan
Bangladesh
Belgium
Brazil
Bulgaria
Cananda
Cape Verde
Chile
China
Colombia
Cook Islands
Croatia
Cuba
Cyprus
Denmark
Dominican Republic
Ecuador
Egypt
Estonia
Fuji
France
French Polynesia
Martinque
Germany
Ghana
Greece
Guyana
Iceland
India
Indonesia
Iran (Islamic Republic of)
Ireland
Italy
Japan
Kenya
Korea (Democratic People's
Republic of)
2006
2007
2008
2009
2010
889
433
-
-
3,927,297
6,389
369
-
622
-
2,406
4,723,151
-
-
492
-
-
23,418
-
-
-
2,426
182
626
-
-
-
-
-
6,533,954
-
147
1,433
45,706
-
-
2011
-
3,852
-
-
5,837,137
16,005
8,749
-
21,205
-
1,908 -
5,968,520
7,519
-
738
-
-
28,672
-
17,218
-
3,593
331
-
-
8,714
-
-
-
1,102
-
-
-
-
8,504,517 12,210,082
-
9,110
-
126
173 -
-
-
-
-
-
-
1,888
-
2012
-
12,762
-
-
8,837,828
36,441
6,980
-
18,624
-
8,167,710
-
-
2,814
3,711
-
46,416
9,205
27,733
-
852
5,102
-
4,057
-
-
-
-
1,005
898
-
-
2,307
10,815
-
487 -
-
-
2,230
-
144
721
-
-
852,990 1,332,492 2,458,113
7,561,258
-
-
2,813
6,695
- -
-
-
-
836
136 -
-
125
597 -
-
712 -
495
990
-
-
-
-
-
-
-
-
274
807
-
-
-
-
8,087,096
14,918
-
-
-
13,343
-
-
-
-
1,448
-
2,211 -
6,794,891
26,863
-
-
106
7,982
895
-
236
-
-
2013
1,511
-
-
-
7,304,784
10,351
-
1,640
18,810
-
295
7,083,536
-
-
855
-
121
56,369
-
3,986
-
2,422
3,115
2014
-
-
-
-
5,519,035
14,435
-
-
21,436
-
-
4,975,527
-
-
463
-
122
30,510
6,659
-
9,085
-
304
-
2015
-
-
-
84,687
7,517,000
19,671
-
-
13,816
-
-
4,036,142
-
-
219
-
-
38,131
10,770
-
-
-
-
-
-
-
-
-
-
-
-
28,697
4,807
-
103
-
208
-
-
-
2,882,503 1,837,988 4,176,026
6,608,531
2,064
878
11,554
5,267
-
-
447
467
-
-
-
2,406
21,328
8,233
1,495
161
- -
-
1,290
-
1,110 -
-
254,146
340,738
927,762
7,737,730
-
6,788
-
-
-
912
465
-
403 -
242
-
-
-
-
-
-
-
-
-
15,688
11,538
12,011
15,829
-
-
-
-
-
-
-
-
-
-
-
2,143
-
239
2,342 -
-
-
-
-
373
-
-
3,395
Max.ann'l recl.vol.
Max 2006-2015
1,511
28,697
4,807
84,687
8,837,828
36,441
8,749
2,406
21,436
1,290
2,406
8,167,710
7,519
912
2,814
3,711
122
56,369
10,770
27,733
9,085
3,593
304
5,102
626
4,057
274
8,714
10,815
2,230
2,211
12,210,082
26,863
126
836
1,433
45,706
895
1,888
4,558,446
7,283
-
-
-
-
-
-
I:\MEPC\71\MEPC 71-INF.2.docx
URU, Alm.del - 2016-17 - Endeligt svar på spørgsmål 300: Spm., om ministeren vil oplyse de 10 vigtigste lande at kontakte mhp. at fremme ratifikationsprocessen af Hong Kong-konventionen, til miljø- og fødevareministeren
1799009_0002.png
MEPC 71/INF.2
Annex, page 2
TABLE 1 (continued): DETERMINATION OF ANNUAL SHIP RECYCLING VOLUME (Data by IHS Maritime & Trade)
RECYCLING STATE
Korea (Republic of)
Latvia
Lithuania
Madagascar
Malta
Mexico
Montenegro
Morocco
Namibia
Netherlands
Curacao
New Zealand
Nigeria
Norway
Oman
Pakistan
Panama
Papua New Guinea
Peru
Philippines
Poland
Portugal
Romania
Russian Federation
Slovenia
South Africa
Spain
Sweden
Thailand
Trinidada and Tobago
Turkey
Ukraine
United Arab Emirates
United Kingdom
Bermuda
Gibraltar
United Republic of Tanzania
United States
Uruguay
Viet Nam
Venezuela (Bolivarian Republic of)
UNKNOWN
TOTALS
2006
-
2,434
4,584
745
1,396
-
-
4,825
-
-
-
-
186,987
-
-
-
-
-
-
-
19,404
-
-
6,871
-
-
-
148,448
10,165
-
2,771
-
-
-
79,362
-
5,813
78,574
4,591,645
2007
-
11,384
685
-
-
120
-
1,485
-
1,390
-
489
-
379,601
-
-
-
-
-
1,409
-
9,848
-
802
1,041
-
-
-
117,817
-
-
2,535
-
-
-
47,490
-
3,834
18,834
4,152,847
2008
-
118
2,699
-
8,671
-
-
6,602
-
3,007
-
6,261
574
273,937
-
-
-
-
-
249
109
12,348
-
-
6,165
-
677
-
141,351
-
950
-
134
-
520
196,410
-
-
22,534
8,279,787
-
721
-
-
-
-
4,185
-
-
4,015
-
-
2,100,637
-
-
6,892
-
-
3,466
-
5,318 -
-
585
14,206
-
-
400
557,251
717 -
-
2,411
-
-
-
10,868
-
-
270,829
24,958,520
-
-
-
818
-
2,443,304
2,125
614
-
7,977
-
2,933
-
-
453
11,709
-
-
-
658,473
-
707
-
-
-
133,428
203
-
138,715
18,674,032
-
-
-
-
538
-
1,044
-
3,610
-
3,013,926
789
-
-
-
-
-
-
3,924
-
292
8,285
-
-
1,747
1,067,425
825
-
2,269
-
2,099
-
204,348
-
-
253,993
25,016,373
-
2,894
-
5,499,481
1,440
-
-
1,216
2,857
-
-
3,075
312
-
16,656
-
-
-
1,540,800
4,517
-
1,249
-
-
3,119
114,908
-
15,616
191,631
36,819,398
2009
673
2010
-
695
1,400
2011
-
1,857
2,303
947
9,304
-
-
6,647
-
222
2012
-
2,065
1,895
-
18,659
-
-
188
-
-
2,579
3,790
-
5,376,443
-
-
-
4,036
-
3,095
9,160
2,175
-
-
7,468
19,638
-
-
1,369,955
1,836
-
582
-
-
-
168,716
-
67,437
62,676
29,833,768
2013
11,246
3,911
14,002
571
141
95,052
-
3,025
-
2,001
-
-
2,292
-
4,092,971
3,305
-
-
3,828
-
1,862
2,356
1,383
-
647
7,517
-
-
5,423
977,695
-
-
6,302
-
-
114,666
1,378
23,382
1,155
53,432
22,764,630
2,773
1,408
2014
10,502
398
7,617
-
26,309
-
-
2015
5,967
-
3,468
-
26,308
-
-
2,692
11,288
1,599
149
836
1,109
-
4,588,831
-
1,849
-
14,875
454
-
-
1,638
-
1,895
11,422
4,166
865
-
751,759
-
-
1,848
195
-
7,431
-
10,280
-
59,272
21,796,597
Max.ann'l recl.vol.
Max 2006-2015
11,246
11,384
14,002
571
947
95,052
120
3,025
2,692
11,288
1,599
3,007
4,015
6,261
574
5,499,481
3,305
1,849
6,892
14,875
2,857
3,466
9,160
19,404
312
1,895
16,656
19,638
865
5,423
1,540,800
10,165
950
6,302
134
2,099
3,119
204,348
1,378
67,437
1,155
270,829
37,523,335
*
A dispute exists between the Governments of Argentina and the United Kingdom of Great Britain and Northern Ireland concerning sovereignty over the Falkland Islands (Malvinas).
I:\MEPC\71\MEPC 71-INF.2.docx
URU, Alm.del - 2016-17 - Endeligt svar på spørgsmål 300: Spm., om ministeren vil oplyse de 10 vigtigste lande at kontakte mhp. at fremme ratifikationsprocessen af Hong Kong-konventionen, til miljø- og fødevareministeren
1799009_0003.png
MEPC 71/INF.2
Annex, page 3
Table 2: World Fleet in GT terms
TABLE 2: WORLD FLEET IN GT TERMS (Date by IHS Maritime & Trade)
2007
WORLD FLEET
40% of WORLD FLEET
3% of 40%
774,936,508
309,974,603
9,299,238
2008
830,704,412
332,281,765
9,968,453
2009
882,634,804
353,053,922
10,591,618
2010
957,982,304
383,192,922
11,495,788
2011
1,043,081,509
417,232,604
12,516,978
2012
1,081,204,742
432,481,897
12,974,457
2013
1,122,649,460
449,059,784
13,471,794
2014
1,166,847,462
466,738,985
14,002,170
2015
1,211,877,004
484,750,802
14,542,524
2016
1,248,583,186
499,433,274
14,982,998
Table 3: Annual ship recycling volume of the largest ship recycling countries
TABLE 3: ANNUAL SHIP RECYCLING VOLUME OF THE LARGEST SHIP RECYCLING COUNTRIES (Date by IHS Maritime & Trade)
RECYCLING STATE
BANGLADESH
CHINA
INDIA
PAKISTAN
TURKEY
Sum of top five recycling States
Rest of the world
WORLD TOTAL
% of top five to world totals
2006
2,882,503
254,146
852,990
186,987
148,448
4,325,074
266,571
4,591,645
94%
2007
1,837,988
340,738
1,332,492
379,601
117,817
4,008,636
144,211
4,152,847
97%
2008
4,176,026
927,762
2,458,113
273,937
141,351
7,977,189
302,598
8,279,787
96%
2009
6,608,531
7,737,730
7,561,258
2,100,637
557,251
24,565,407
393,113
24,958,520
98%
2010
3,927,297
4,723,151
6,533,954
2,443,304
658,473
18,286,179
387,853
18,674,032
98%
2011
5,837,137
5,968,520
8,504,517
3,013,926
1,067,425
24,391,525
624,848
25,016,373
98%
2012
8,837,828
8,167,710
12,210,082
5,499,481
1,540,800
36,255,901
563,497
36,819,398
98%
2013
7,304,784
7,083,536
8,087,096
5,376,443
1,369,955
29,221,814
611,954
29,833,768
98%
2014
5,519,035
4,975,527
6,794,891
4,092,971
977,695
22,360,119
404,511
22,764,630
98%
2015
7,517,000
4,036,142
4,558,446
4,588,831
751,759
21,452,178
344,419
21,796,597
Max.ann'l recl.vol.
Max 2006-2015
8,837,828
8,167,710
12,210,082
5,499,481
1,540,800
36,255,901
1,267,434
37,523,335
10 year average:
98%
97%
___________
I:\MEPC\71\MEPC 71-INF.2.docx