Europaudvalget 2023
KOM (2023) 0600
Offentligt
EUROPEAN
COMMISSION
Brussels, 24.5.2023
SWD(2023) 638 final
COMMISSION STAFF WORKING DOCUMENT
In-depth review for Luxembourg
Accompanying the document
COMMUNICATION FROM THE COMMISSION TO THE EUROPEAN
PARLIAMENT, THE COUNCIL, THE EUROPEAN CENTRAL BANK, THE
EUROPEAN ECONOMIC AND SOCIAL COMMITTEE, THE COMMITTEE OF
THE REGIONS AND THE EUROPEAN INVESTMENT BANK
2023 European Semester – Spring Package
{COM(2023) 600 final} - {SWD(2023) 628 final} - {SWD(2023) 629 final} -
{SWD(2023) 630 final} - {SWD(2023) 631 final} - {SWD(2023) 632 final} -
{SWD(2023) 633 final} - {SWD(2023) 634 final} - {SWD(2023) 635 final} -
{SWD(2023) 636 final} - {SWD(2023) 637 final} - {SWD(2023) 639 final} -
{SWD(2023) 640 final} - {SWD(2023) 641 final} - {SWD(2023) 642 final} -
{SWD(2023) 643 final} - {SWD(2023) 644 final}
EN
EN
kom (2023) 0600 - Ingen titel
Luxembourg
In-Depth Review 2023
kom (2023) 0600 - Ingen titel
On the basis of this in-depth review for Luxembourg undertaken under
Regulation (EU) No 1176/2011 on the prevention and correction of
macroeconomic imbalances, the Commission has considered in its
Communication “European Semester – 2023 Spring Package” (COM(2023)
600 final) that:
Luxembourg
is not found to experience imbalances. Vulnerabilities relating to
high house prices and high household debt have recently increased but overall
seem to be contained so far and are expected to ease over the medium term.
Strong population growth alongside increased mortgage credit, incentivised by
fiscal support, has pushed up demand for housing, while supply has been
restricted by the limited land available for construction and by land hoarding. The
widening gap between housing demand and supply has resulted in strong house
price increases with growing risks of house prices overvaluation and deteriorating
affordability. House prices clearly cooled in late 2022, and the number of housing
transactions declined sharply, as the rise in interest rates have led to a turn in the
market. However, a sharp correction in house prices is not expected as incomes
are holding up well and the supply shortage is expected to continue. Household
debt is very high in terms of disposable income and has been increasing while
borrowing cooled somewhat in late 2022. Households’ financial assets are also
substantial, indebtedness increases towards the higher levels of income and
wealth, and the banking sector is sound, which overall mitigates macro-financial
risks. Additional policy efforts, including by stepping up and prioritising the
adoption and implementation of recent measures, including recurrent taxes to
increase the supply of buildable land, combined with the ongoing reform of land-
use planning, could help to boost housing supply, including through the supply of
affordable and social housing targeted to those most in need. The efficiency of
the rental market could be improved too. In addition, reducing the mortgage
interest deductibility, which was recently significantly increased, would reduce the
fiscal incentives to borrow which supports high house prices.
kom (2023) 0600 - Ingen titel
CONTENTS
1. Introduction
2. Assessment of macroeconomic vulnerabilities
4
5
LIST OF TABLES
Table 2.1:
Table 2.2:
Table 2.3:
Table 2.4:
Evolution of maximum mortgage interest deductible from taxable income
Impact of different MITR policies in households borrowing capacity
Selected economic and financial indicators (Part 1), Luxembourg
Selected economic and financial indicators (Part 2), Luxembourg
13
15
19
20
LIST OF GRAPHS
Graph 2.1:
Graph 2.2:
Graph 2.3:
House price, credit, population, and employment
Price-to-income ratio
House price, rent and income (nominal terms) in Luxembourg and household debt-to-income ratio in EU Member
States
Graph 2.4:
Graph 2.5:
Graph 2.6:
Graph 2.7:
Share of owners and foregone tax revenue
Nominal interest rate
Selected graphs, Luxembourg
Components of gross fixed capital formation deflator growth and consumer price inflation
9
14
14
17
18
6
7
kom (2023) 0600 - Ingen titel
1.
INTRODUCTION
In 2022, over the previous annual cycle of surveillance under the Macroeconomic
Imbalance Procedure (MIP), Luxembourg was not subject to an in-depth review to assess
its vulnerabilities.
(
1
) The 2023 Alert Mechanism Report published in November 2022 concluded
that an in-depth review (IDR) should be undertaken for Luxembourg this year, with a view to
examine newly emerging vulnerabilities and their implications. (
2
) The AMR concluded that in
Luxembourg, concerns related to house price developments and high household debt had increased.
Nominal house price growth was among the highest in the EU, raising concerns about overvaluation
and high household debt. Household debt as a percentage of household gross disposable income
was declining but remained very high. The banking sector was stable but faced some risks. Some
competitiveness concerns may have been emerging, amid continued unit labour cost growth.
Luxembourg’s GDP growth was above the EU average in recent years driven by solid
domestic demand and net exports.
The economy fared relatively well during the COVID-crisis
mainly due to the large share of services in the economy and significant government support.
Following a strong recovery from the pandemic in 2021, with GDP growth of 5.1%, Luxembourg’s
economic activity slowed to 1.5% in 2022. This decline was mainly due to lower private
consumption and a fall in investments following high inflation, tighter financing conditions and
geopolitical uncertainty. Going forward, real GDP growth is projected to be at 1.6% in 2023, before
recovering to 2.4% in 2024, mainly due to an improvement in net exports and investments. (
3
)
Following the headline inflation peak of 8.2% in 2022, on the back of elevated energy and food
prices, inflation is projected to decrease significantly to 3.2% in 2023. This can be explained by the
projected decrease in energy prices in combination with the fiscal support measures to limit
inflation that were extended until end 2024. A further decline to 2.6% is forecast for 2024, due to
a fall in all inflation components. Core inflation is expected to remain high in 2023 mainly driven by
the increase in compensation of employees, before declining in 2024.
This in-depth review presents the main findings of the assessment of macroeconomic
vulnerabilities for Luxembourg.
The assessment is backed by a thematic section on the housing
market. Vulnerabilities related to housing in Luxembourg are also discussed in a horizontal
thematic note that was recently published. (
4
) The MIP assessment matrix is published in the 2023
Country Report for Luxembourg. (
5
)
(
1
) European Commission (2022), European Semester Spring Package 2022, COM(2022) 600 final.
(
2
) European Commission (2022), Alert Mechanism Report 2023, COM (2022) 381 final.
(
3
) European Commission (2023), European Economic Forecast: Spring 2023, Institutional Paper 200.
(
4
) European Commission (2023), Housing Market Developments: Thematic Note to Support In-Depth Reviews, European
Economy: Institutional Papers, 197.
(
5
) European Commission (2023), Country Report Luxembourg 2023, SWD(2023) 616 final.
4
kom (2023) 0600 - Ingen titel
2. ASSESSMENT OF MACROECONOMIC
VULNERABILITIES
Gravity, evolution and prospects
On 5 April 2023 the Commission presented a horizontal thematic note on housing
market developments, including Luxembourg.
It demonstrated that house prices in
Luxembourg have more than doubled in nominal terms over the last decade, with a large share of
this increase taking place over the last four years. As a result, the price-to-income ratio experienced
one of the highest increases in the EU, reflecting affordability issues. Strong economic and
demographic dynamics have driven housing demand, while supply has persistently lagged.
However, a potential correction of house prices, following a significant increase in interest rates and
an increase in unemployment, and considering the high household mortgage debt, raises financial
stability concerns for the domestically oriented banks, which hold roughly 90% of mortgage debt.
Over the last decade, house prices in Luxembourg have increased markedly.
Between
2012 and 2022, house prices have increased by 118% in nominal terms (44% in the euro area),
with half of this increase taking place over the last four years. The continued strong increase of
house prices in 2021, led the ESRB to conclude in February 2022 that real-estate related risks were
high and that the measures in place were only partially appropriate and partially sufficient and
argued for additional income-based measures, such as debt-to-income limits. (
6
) In 2022, a
slowdown in house price growth was observed following the tightening of financing conditions. The
y-o-y growth in 2022 still amounted to 9.6% (13.9% in 2021 and 14.5% in 2020), but the fourth
quarter saw a decline in prices versus the previous quarter (-1.4%). Also the number of transactions
and the mortgage volumes showed a decrease in line with the slowdown of the housing market. In
2022, house prices in Luxembourg have remained less sensitive to changes in the economic and
financial environment, compared to other Member States.
Statistical indicators suggest that the long-term price increases have led to an
overvaluation in the Luxembourg housing market.
The Commission estimates the
overvaluation gap in Luxembourg at 63% in 2022. (
7
) This is an unweighted average of three
indicators in the range of 10% to 97%, which shows the wide variety of these estimates, although
all point to an overvaluation. (
8
)
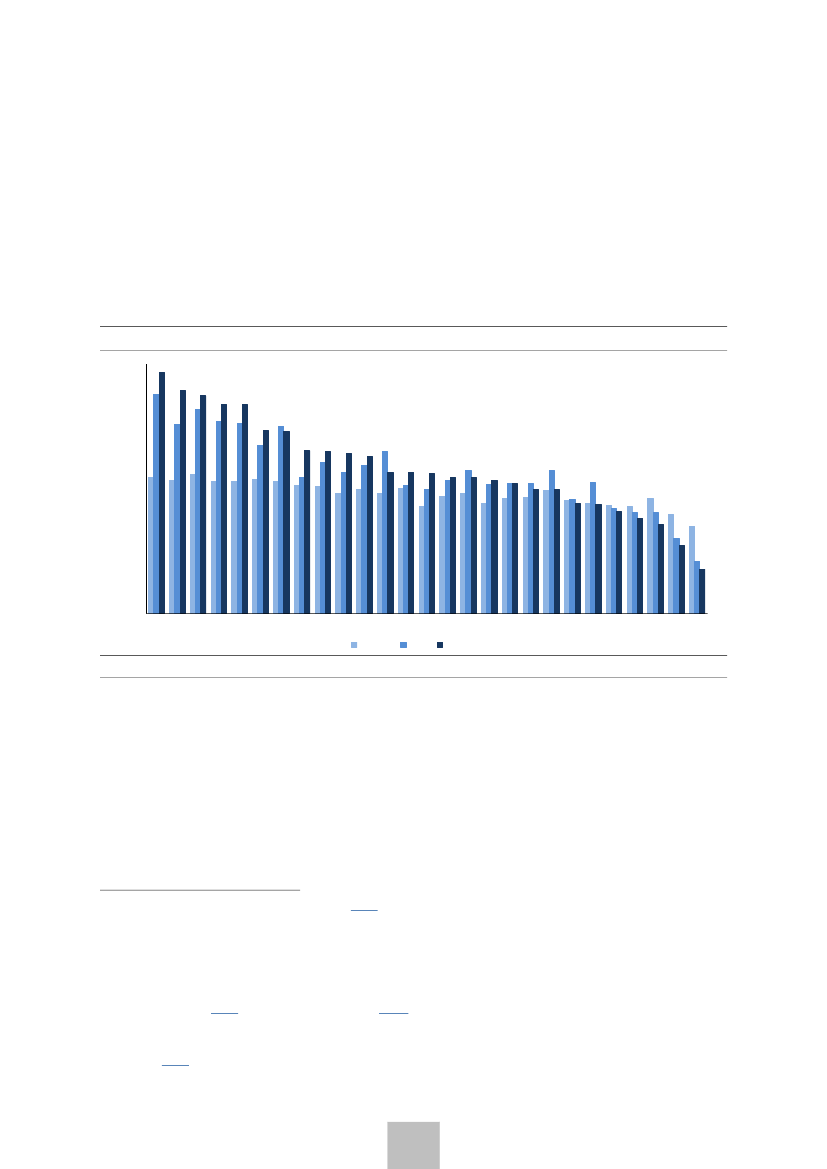
House prices have increased faster than income, raising affordability concerns.
The
affordability issue is evidenced by the growth divergence between households’ income and house
prices, especially since 2015; real disposable income per head grew by 8%, while real house prices
increased by 63% between 2015 and 2022. Therefore, the price to income ratio has risen by
around 50% since 2015, one of the highest increases among the euro area Member States in
(
6
) ESRB, Vulnerabilities in the residential real estate sectors of the EEA countries February 2022.
(
7
) The Commission overvaluation gap is the unweighted average of the price-to-income (81%), price-to-rent (97%) and
model valuation gaps (10%). The latter is an econometric model based on fundamental drivers; population, interest rates
and housing supply (see also table 2.4).
(
8
) BCL reported in their Financial Stability report 2022 an 26% overvaluation in first trimester 2022, the ECB reports a 54%
average overvaluation gap end 2022.
5
kom (2023) 0600 - Ingen titel
2.
Assessment of macroeconomic vulnerabilities
2021. (
9
) The affordability concern is aggravated by the fact that only 2% of the total housing
stock is rented at social and affordable prices. (
10
)
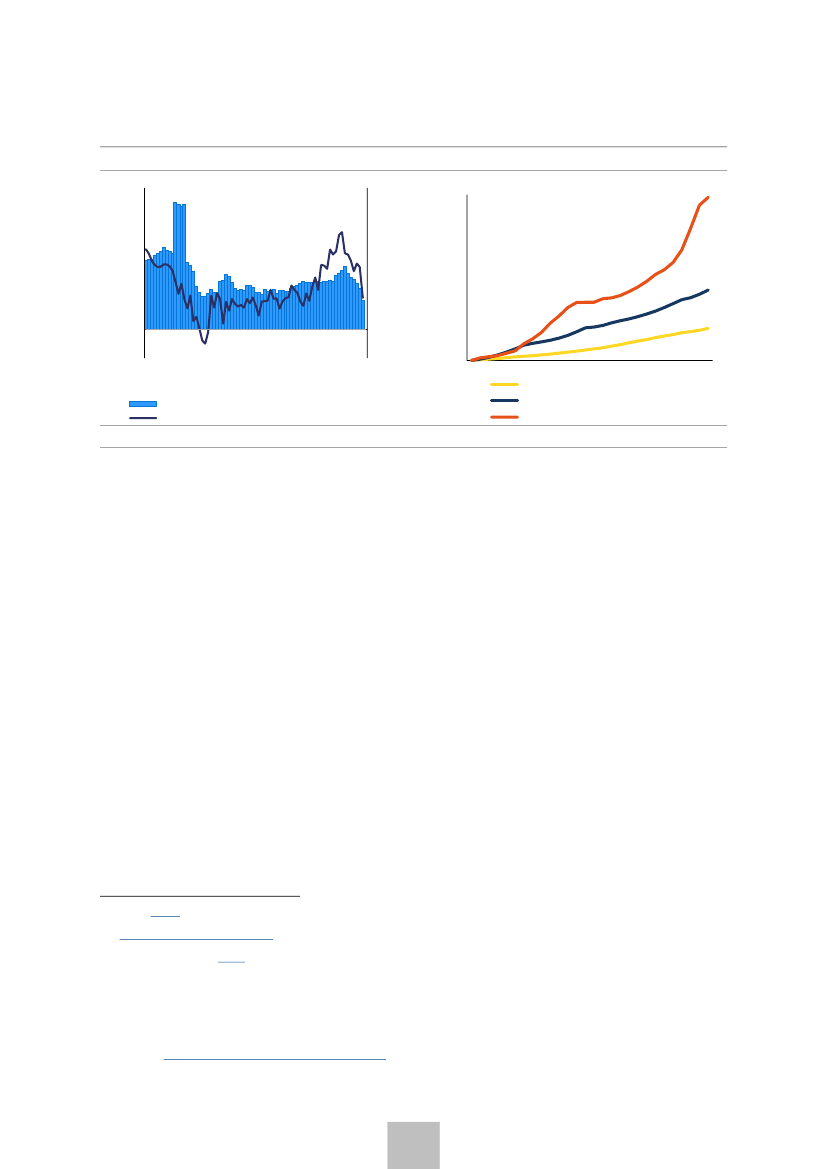
Graph 2.1:
House price, credit, population, and employment
25
a)Real house price and mortgage growth
25
400
20
Rate of change y-o-y (%)
15
10
5
0
-5
b) Evolution of house prices, population and
employment
20
350
15
10
5
0
-5
Rate of change y-o-y (%)
1995 = 100
300
250
200
150
100
95 97 99 01 03 05 07 09 11 13 15 17 19 21
Population
04Q4
05Q4
06Q4
07Q4
08Q4
09Q4
10Q4
11Q4
12Q4
13Q4
14Q4
15Q4
16Q4
17Q4
18Q4
19Q4
20Q4
21Q4
22Q4
MFI loans for house purchase (y-o-y growth rate)
Nominal House Price Index (y-o-y growth rate), right axis
Employment in resident production units
Deflated house price index
Source:
Eurostat, ECB and European Commission services
The strong economic growth has led to a high increase in employment and disposable
income, also stimulating demand for housing and mortgage credit.
An uneven acceleration
of demand across income quartiles was observed in recent years. It was especially strong among
the higher income levels, while demand from the bottom quartiles decreased in relative terms. Four
packages of high energy price support measures have been adopted by the government since
2021, supporting income and employment until the end of 2024.
Demand was further stimulated by a higher participation of (foreign) investors attracted
by the high house price increases.
The higher participation from investors, notably in the market
segment of newly built apartments, also contributed to pushing up house prices. Over 40% of this
type of dwellings were purchased by investors between 2015 and 2021 (
11
), pointing to a demand
shift towards buy-to-let investments. The fall in real (
12
) rental yields did not discourage buy-to-let
investors. This implies positive expectations on tax advantages and capital gains. (
13
) Investors’
participation seems to have started to decline in 2021 following the 80% loan-to-value (LTV)-limit
and more strongly in 2022 following the rise in interest rates. Despite the increases, buy-to-let
housing remains limited in the housing market. (
14
)
The strong increase in mortgage credit has fuelled the large house price increases, and
fiscal support has contributed to this.
The growth in employment and income combined with
very low financing costs and strong fiscal support have spurred mortgage growth since the 2008-
2009 financial crisis. Borrowers benefited from historically low mortgage rates, which increased
their capacity to borrow. The large fiscal support to home ownership partly explained the higher
credit growth in recent years, compared to other Member States (see also Box 1). The 2017 tax
(
9
) ESRB,
2022.
(
10
)
Note-30-en-bref.pdf (public.lu).
(
11
) Ministry of housing,
2022.
(
12
) In January 2021, differentiate loan-to-value limits were enforced: 100% for first time buyers, 90% for primary residents
and 80% buy-to-let and other investors.
(
13
) Rental income is also capped at 5 percent of the purchase value of the dwelling, but tax deductions stimulate the return on
investment during the first five years after purchase. Rents can be revalued when tenants change.
(
14
) Eurostat
House or flat – owning or renting (europa.eu).
6
kom (2023) 0600 - Ingen titel
2.
Assessment of macroeconomic vulnerabilities
reform abolished the taxable rental value and increased mortgage interest deduction for the main
residence and introduced an increased threshold for deducting home purchase savings
contributions. In 2015, the ceiling for the VAT super reduced rate on newly constructed home,
previously linked to the value of the house, was replaced by a ceiling on deductibility. In 2017, the
temporary budgetary compensation tax of 0.5 percent was abolished, and several tax credits have
been introduced. Together, these various fiscal measures represent large support. (
15
) This makes
Luxembourg as one of the highest spenders on housing subsidies in advanced economies. The
borrowing capacity of most households have decrease due to higher mortgage rates in 2022 and a
deterioration of real incomes due to elevated inflation. This is slowing down demand and a sharp
decline in the growth rate of mortgages has been observed. (
16
) In the last high energy price
support package, the government took two fiscal measures to support mortgage demand (see also
policy section).
Graph 2.2:
Price-to-income ratio
150
125
2015 = 100
100
75
50
LU
NL
PT
CZ
AT HU DE
IE
ES
SI
SK
DK
LV
EE
FR
SE
LT
BE
EL MT HR
PL
FI
IT
BG
CY
RO
2014-20
2021
2022
Source:
Eurostat and European Commission services
Strong demographic dynamics have driven up the housing demand, with housing supply
persistently lagging demand.
Between 2010 and 2021, the population increased by around 30%
(versus 5% in the euro area), more than 7,000 households per year (
17
). Meanwhile, the pace of
production of new dwellings was below 4,000 units per year (Graph 2.6, panel b), significantly
below estimated demand between 6,200 and 8,000 (
18
). This has resulted in a structural housing
shortage and increased pressure on house prices. This has been partly mitigated by the cross-
border housing market, with an increasing number of non-resident workers commuting across
borders every day, mainly from Germany, France and Belgium. Commuting workers reached 204.6
thousand in 2021, around 42% of domestic employment. This creates a large pool of pending
demand for housing in Luxembourg. The low supply of housing is also due to the high concentration
(
15
) Estimated at 2.5% of GDP by Girshina, A. et al.
2022.
(
16
) BCL statistic tables (11.7 and 11.9).
(
17
) Furthermore, population is playing a critical role in the county’s broad economic performance, and in particular in the
sustainability of public finances over the long term. In this regard, Luxembourg has been repeatedly addressed Country
Specific Recommendations to ensure the sustainability of its public finances. This is part of the macroeconomic and
budgetary surveillance carried out by the Commission in the framework of the European Semester (see Council
Recommendation,
2022,
and European Commission,
2021,
for a detailed presentation of estimates).
(
18
) Estimated housing demand range between 6,200 and 8,000 housing units per year, from 2018 to 2030, required to
achieve a GDP growth of 3% on average per year, depending on the assumptions on the share of cross-border workers
STATEC,
2019.
7
kom (2023) 0600 - Ingen titel
2.
Assessment of macroeconomic vulnerabilities
of land (
19
) which allows landowners to adjust markups and reap a larger share of the fiscal
support to homeowners. (
20
)
The stock of social housing is one of the lowest in the EU.
The limited stock partly reflects
the preference of public providers who used to allocate about one third of constructed units to
renting and two thirds for sale and the past practice of allowing re-sale of subsidised housing on
the non-subsidised housing market.
Construction activity has slowdown in 2022, driven by the rise in interest rates, but the
impact on GDP is expected to be small.
Construction activity started to slow down in 2021,
following disruptions in production chains and higher inflation, which significantly raised
construction costs. With the rise in interest rates housing demand from households and buy-to-let
investors (
21
) weakened, slowing down supply and reducing construction activity. The lower activity
in residential construction is expected to have a small impact on the country’s aggregate economic
growth, since its weight is less than 5% in GDP. (
22
)
Existing rental prices have increased much slower than consumer prices, in contrast with
advertised rents that have even accelerated in the short term.
Rental prices increased by
1.3% on average per year from 2010 to 2022, which was lower than growth of the harmonised
consumer prices, despite a small acceleration in 2022 to 2%. Existing rents are not regularly
adjusted for inflation, partly because automatic indexations are not enforceable in lease contracts
and need to be negotiated between the owner and the tenant. New rents are significantly higher
than existing ones. Advertised (
23
) rental prices increased by around 3%, on average per year, in line
with inflation, and accelerated significantly, (by 8.0% in Q4-2022 year-on-year) in line with the
harmonised index of consumer prices (8.4% in Q4-2022 year-on-year). This increase might be
explained by further demand shifting from home ownership towards renting, a trend also observed
in previous years (between 2017 and 2021 the share of tenants increased by 3.6pps to 28.9%). (
24
)
This could be due to increased affordability problem, which is likely to be aggravated by the
introduction of loan-to-value limits in 2021 and the rise in interest rates in 2022.
The rise in interest rates has led to a turn in the housing market but a sharp correction
in house prices is not expected.
While the financial cycle has entered a downward trend a sharp
housing price drop is not expected. The impact on prices tends to be dampened by supply
adjustments (
25
), therefore price volatility from a cyclical downturn is expected to be weaker in
Luxembourg, compared with other Member States. Although house prices declined q-o-q in
Q4-2022, for the full year a still high price growth of 9.6% was observed. Considering the sharp
decline in the number of transactions and mortgage credit amounts, such a steady growth in house
prices appears remarkable. It also results from the practice of sales retention by developers to
(
19
) Despite the relative abundance of constructible land in Luxembourg, land supply appears to be a key limiting factor for
housing supply, supporting house price inflation. The price of constructible land, which accounts for 20%-40% of the
housing sales value, increased by 136.5% between 2010 and 2021, higher than house prices.
(
20
) Girshina, A. et al.
2022.
(
21
) Since rising interest rates makes real estate investment more expensive, and at the same time alternative investments
become relatively more profitable.
(
22
) According to Luxembourg Annual National Accounts, Gross fixed capital formation dwellings and GDP (EUROSTAT).
(
23
) This indicator is published by STATEC based on data collected from estate retailers and provides a gauge of current prices
for households accessing the rental market, as opposed to the standard indicator of rental prices, which includes all existing
rents. Figures need to be taken with care though, since they are not adjusted for the characteristics of the dwellings
announced and may diverge from the rent eventually agreed between owner and tenant.
(
24
) Eurostat:
Statistics | Eurostat (europa.eu).
(
25
) In this line, house sellers respond swiftly, adjusting activity, to dampen negative short-term price dynamics.
8
kom (2023) 0600 - Ingen titel
2.
Assessment of macroeconomic vulnerabilities
sustain price levels (
26
), in expectation of demand to recover momentum. (
27
) The labour market is
expected to remain resilient with solid domestic employment growth of 2.4% in 2023 and 2.3% in
2024 and a low level of unemployment (4.8% in 2023 and 5.0% in 2024) (Commission Spring
2023 forecast). Therefore, disposable income, supported by the automatic wage indexation, is
expected to continue to grow. After the ’absorption’ of the interest rate shock, the structural higher
demand versus supply is expected to continue to drive house price increases.
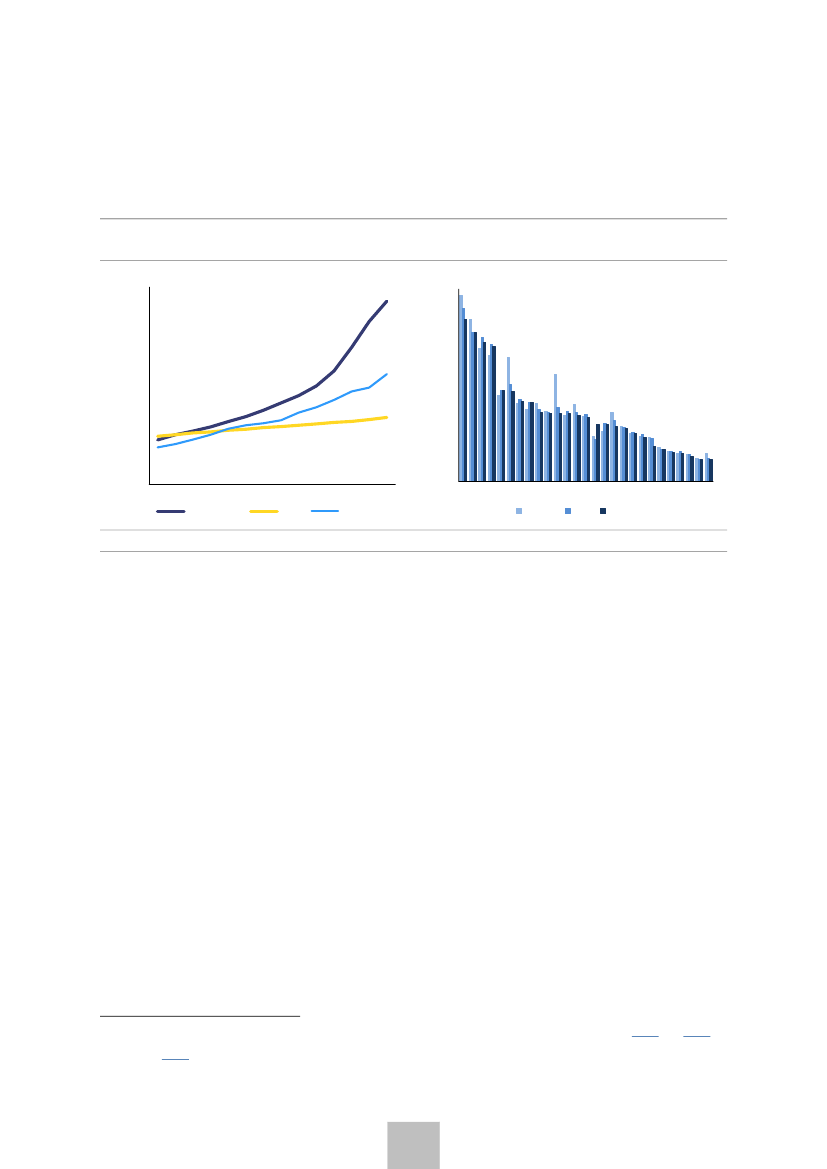
Graph 2.3:
House price, rent and income (nominal terms) in Luxembourg and household debt-to-
income ratio in EU Member States
250
a) Evolution of house prices, rents and household
income
250
b) Household debt
(2010=100)
200
% of gross disposable income
200
150
150
100
100
50
09 10 11 12 13 14 15 16 17 18 19 20 21 22
House prices
Rent
Income
Source:
Eurostat and European Commission services
In recent years, concerns have increased with regard to the housing market because of
the high household debt, especially in terms of disposable income.
Household debt as
percentage of disposable income continued trending upward and is substantially higher compared
to other Member States. At an aggregate level, household debt reached 180% of disposable
income in 2022, 61% above its long-term average, which is one of the highest deviations from its
historical average among the EU Member States. Household debt is largely attributable to the
strong growth in residential real estate loans, as bank mortgages account for more than 80% of
household debt (146% of disposable income). A long period of supportive financial conditions and
fiscal policies have favoured home ownership over tenancy contributing to sustain mortgage credit
growth. In line with growth of house prices, mortgage credit increased steadily since 2009, at a
stable rate of 5.4% on average in real terms (Graph 2.3). Households require a larger share of their
income to pay their mortgages, which limits the access to home ownership for an increasing
proportion of the population, especially among lower income households, such as starters and
young households.
The risk for the domestic banks is mitigated because a large share of debt is owed by
wealthy households.
Luxembourg’s has a large financial sector but just a few national banks are
exposed to the housing market. Domestic banks are exposed to vulnerabilities related to high
housing price declines and the high household debt. However, a significant share of the financial
sector is internationally oriented and with a high level of foreign ownership. The activities of foreign
banks are mainly cross-border intra-company and international corporate finance and investment
focused and therefore have a limited interaction with domestically oriented banks. Households’
financial assets are also high, therefore mortgage debt appears to be well covered by the liquid
financial assets at an aggregate level. Net financial assets compared to the national income are
(
26
) The construction sector is run by a few large companies, which also own land (Observatoire de l'Habitat,
2022
and
2021).
(
27
) STATEC,
2023.
9
DK
NL
SE
LU
FI
CY
BE
FR
PT
MT
IE
DE
ES
AT
HR
SK
EL
EE
IT
CZ
PL
SI
BG
LT
HU
RO
LV
2014-20
2021
2022
50
0
kom (2023) 0600 - Ingen titel
2.
Assessment of macroeconomic vulnerabilities
close to the euro area aggregate, at 267%, and total savings and deposits, which reached
EUR 54.7 billion in Q3-2021, are above the aggregate stock of debt of EUR 50.9 billion. Moreover, a
distributional perspective on mortgage affordability and debt-to-income and wealth levels point to
lower vulnerabilities in the household sector than the aggregate measures might suggest. In
addition, lower income households hold lower debt, as breakdowns of households by both income
and wealth show. Among the lower income households there are relatively fewer homeowners and
more tenants. Whereas the average cost of mortgage loans increased over the period 2020 to
2022, it remains low, rising from 1.32% to 1.46%, while only 5.4% of homeowners with a
mortgage had a housing debt burden above 25% of their disposable income, compared with 13.6%
in the EU. (
28
) Furthermore, the proportion of mortgages at adjustable rates has significantly
decreased recently and currently stands at 40%, while most of the mortgages granted in recent
years were at fixed rates. (
29
) Finally, the highly resilient labour market and very low unemployment
rates, sound public finances and strong social security are important factors supporting borrowers’
debt servicing capacity and contributing to the high level of financial stability in Luxembourg.
Banks’ buffers appear sufficient to absorb potential shocks stemming from the
residential real estate market and mortgage debt.
Nearly 90% of mortgage debt is held by
five domestically oriented banks (out of around 120 MFIs operating in Luxembourg) and accounts
on average for around 25% of their total assets. The effects of stress tests carried out by the
Central Bank of Luxembourg showed a potential decline in the solvency ratio ranging from 0.8pps
to 3.1pps, to reach a ratio of 15.9% in the worst-case scenario of a fall in residential property
prices induced by the estimated default probabilities. (
30
) The weighted average loan-to-value ratio
of the domestic banks active in the residential real estate market, declined from around 78% to
76% in 2021, while the weighted average loan service to income ratio of the five domestic banks
has crept up over the past two years, from 28% in the first half of 2019 to 33% in the second half
of 2021, which is relatively low compared to other Member States. Therefore, the data in 2021
suggests that the introduction of additional capital measures and loan-to-value limits had a
dampening effect on mortgage loan flows and domestic banks appear to have sufficient capital to
absorb housing market shocks.
In general, banks are well capitalised and liquid, and profitability has increased in 2022.
Financial risks for the banking sector mainly stem from the impact of further monetary policy
tightening and the potential heightened volatility in financial markets. Despite the high level of
uncertainty surrounding economic activity, banks’ balance sheets are sound. The rising key rates
weigh on demand for loans, but also support banks’ net interest rate margin, which increased by
39% in 2022 and is expected to increase also in 2023. (
31
) The common equity tier one (CET 1)
ratio remains at 17.6% well above the legal threshold, in Q2-2022 (at 21.4% for domestically
oriented banks). (
32
) The ESRB and BCL projections show that the credit-to-GDP gap, which is the
standard measure recommended by the ESRB to calibrate the counter cyclical capital buffer, turned
negative in 2022 and is expected to remain negative over 2023. (
33
) Although the level of credit-to-
GDP is below its long-term trend, due to the high degree of uncertainty surrounding these
projections, the National Systemic Risk Board decided to maintain the countercyclical capital buffer
at the level of 0.5%, in place since January 2021.
(
28
) BCL FSR 2022.
(
29
) BCL,
2022.
(
30
) BCL FSR 2022.
(
31
) STATEC,
2023.
(
32
) Macro charts Consolidated banking statistics for Luxembourg, domestic stand-alone banks.
(
33
) CdRS,
2023.
10
kom (2023) 0600 - Ingen titel
2.
Assessment of macroeconomic vulnerabilities
Assessment of MIP relevant policies
Household debt remains high in Luxembourg and is incentivised by mortgage interest
deductibility which was recently increased.
The government announced an increase of the
mortgage interest rate tax deductibility and a higher tax credit, as part of the government support
measures in Solidariteitpak 3.0. The government has announced a 50% increase of the mortgage
interest deductibility and an increase in the tax credit from EUR 20 000 to EUR 30 000 for
purchasing building land and residential buildings. Although, this measure is in response to the
higher interest rates and the currently observed slowdown in the housing market, its permanent
nature will further stimulate demand for housing that is already structurally high (see also Box 1).
Conversely, Luxembourg implemented LTV-limits in 2021, which should have a dampening effect,
although the ESRB concluded in 2022 that measures in place were only partially appropriate and
partially sufficient and argued for additional income-based measures, such as debt-to-income
limits.
The tax system favours homeownership compared to other housing tenures, such as
renting, which contributes to strong housing demand.
The favourable tax treatment of
owner-occupied housing is likely to benefit high-income households the most. This is particularly
true for the deductibility of mortgage interest, which is generally regressive, because high-income
households are much more likely to finance their house with mortgage debt. Gradually phasing out
mortgage interest rate deductibility would make taxation of owner-occupied property less
regressive. The introduction of a progressive recurrent tax schedule to the owner and an increase in
the recurrent taxes on immovable property that is based on regularly updated property values also
reduce regressivity of tax systems. However, unless cautiously designed, the introduction of higher
recurrent taxes can have a negative impact on affordability of households with low incomes and
less liquid assets.
The government has presented a package of three tax measures in order to address
some of the supply side obstructions.
The package contains a reform of the current land tax
(IFON), the introduction of a tax on the mobilisation of land (IMOB) and on the non-occupation of
dwellings (INOL). The tax measures aim to increase the supply of land and usage of constructable
land and unoccupied dwellings and therefore is a step in the right direction. However, the package
still needs to pass the legislative process and is implemented over several years, therefore, it’s too
early to assess its effectiveness in addressing the supply side vulnerabilities. The government also
presented some new amendments regarding the
Baulandvertrag
bill on 9 November 2020. This
draft law aims to improve the effectiveness of measures relating to the implementation of urban
development plans ("PAG") to speed up the construction process for new housing. In addition, the
government plans an increase in public investments in housing to support supply, raising them from
3% of total investments in 2022 (EUR 83mln) to 8% (EUR 313mln) in 2026 according to the multi-
annual budget.
Luxembourg does not have a dynamic rental market and rent setting is strongly
regulated.
An increase in the share of rental housing could improve the dynamics of the housing
market. The draft law on residential rental lease, tabled on 31 July 2020 by the Luxembourg
Minister of Housing, is still being debated and no solution before the elections in October 2023 is
foreseen. The law aims to reduce the ceiling on rents, set a maximum deposit amount as guarantee
and increase the transparency of the rent setting to get a ‘fairer’ private rental market. Especially
the rent setting policy with the current ‘5% rule’ does not seem to be effective in increasing
transparency nor limiting rent increases. In addition, the government aims to increase the
construction of rentals in the housing stock via both public and private developers.
11
kom (2023) 0600 - Ingen titel
2.
Assessment of macroeconomic vulnerabilities
The stock of social housing is one of the lowest in the EU.
However, efforts to increase the
share of social rental housing are underway. The sale of social housing has taken the form of a
long-term lease, which is welcome as it effectively captures the value of developed land, which
remains a property of the public housing providers. However, the provision of social and affordable
housing remains insufficiently for low-income households. To overcome existing municipal
resistance to densification, the Housing Pact 2.0 targets were extended to include additional
criteria, such as numerical targets for social housing construction for municipalities. (
34
) The
government plans to increase public investments to support the supply of affordable housing and
affordable and social rentals, in cooperation with the public promoters
Fonds de Logement
and
Société Nationale des Habitations à Bon Marché.
At the start of 2022, Luxembourg announced a
reform of the legal framework on housing to improve affordability. Housing support will be
reformed by two bills that will replace the current law. The first bill will establish a clear framework
for financing affordable housing and supporting its inhabitants. The second bill will extend and
simplify individual support schemes for housing, both rented and owned in the private market. The
objective of this reform is to ensure the right to housing and foster social cohesion. It is too early to
assess the impact of these bills on affordable housing supply at this stage.
The densification of the existing urban and suburban space in the immediate vicinity of
transport network hubs, in particular railway stations, facilitates the use of public
transport.
In that way, densification could lead to shorter commuting trips and encourage
alternative means of travel, which tends to be more competitive with car travel over short
distances. The measure for free public transport was appropriate in this sense. The recent
sustainable mobility strategy emphasises both the multimodal and cross-border dimension and
plans to double the number of park and ride facilities, including at the borders, by 2030. As the
main transportation flows also involve cross-border travel, infrastructure projects require
preparation with support and participation of the neighbouring regions and close involvement of
border municipalities, public and private providers of rail and road transport.
(
34
) One of the Housing Pact 2.0 objectives is a higher number of affordable housing in each ’plan d’aménagement particulier
nouveau quartier’ (PAP NQ)”: a certain percentage of the constructed gross area for housing (10% min) is reserved for
affordable housing. The land on which these houses will be built is transferred to the municipality or the State. In return, the
building potential reserved for housing is increased by 10% compared to the ‘plan d’aménagement général‘ (PAG).
12
kom (2023) 0600 - Ingen titel
2.
Assessment of macroeconomic vulnerabilities
Box 1: Mortgage Interest Tax Relief in Luxembourg
Taxation has been used in many countries with the objective of subsidising homeownership. One of
the most common used tax policies is the possibility for homeowners to deduct the interest paid on
their mortgage from their taxable income, reducing the amount of income tax that they owe. This
measure is commonly known as Mortgage Interest Deduction (MID) or Mortgage Interest Tax Relief
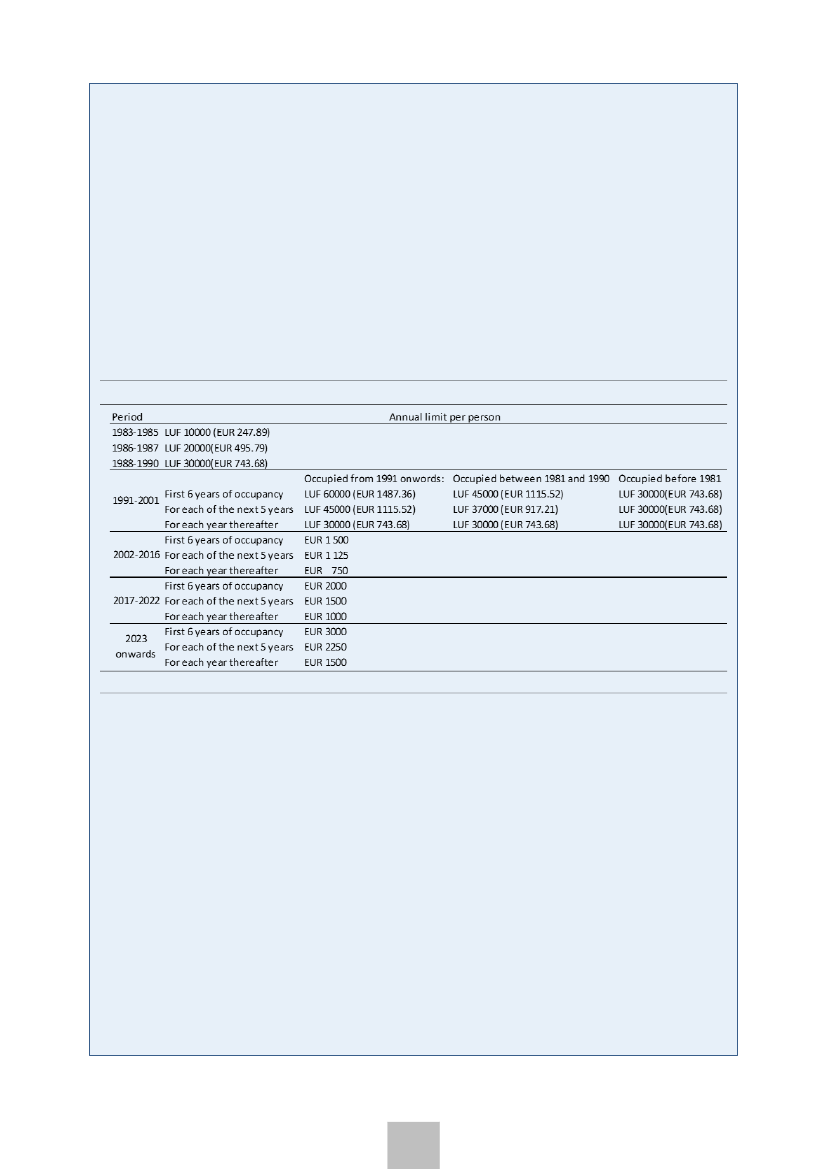
(MITR). MITR has been a part of the Luxembourg’s tax code since 1983 and has been updated since
then. As Table 2.1 shows, the level has increased over time, and there have been two recent
increases in 2017 and 2023. Since the beginning of 2023 interest payments of 3 000 euros per
person could be deducted from taxable income by households that have occupied their house in
2018 or after, for the first 6 years of occupancy. This represents an increase of 50% of deductible
interest payments from 2022 and corresponds to a deductible amount of 12 000 euros per annum
for a family of four.
Table 2.1:
Evolution of maximum mortgage interest deductible from taxable income
Source:
For the legal basis, please follow the link: https://www.legilux.public.lu/eli/etat/leg/rgd/1968/07/12/n2/jo
The objective of governments when they introduce the MITR is to subsidise home ownership,
usually for specific groups, by reducing the burden of interest payments on the mortgage. If supply
of housing is elastic, it could be expected to increase in response to the increased demand.
However, in the case of inelastic, or weakly elastic supply, mortgage interest relief acts only or
primarily to increase demand and drives up property prices. It then acts as a transfer to home
sellers, who are able to secure higher prices for the homes they sell. This is particularly the case for
untargeted measures, which are available to all borrowers, rather than a subset.
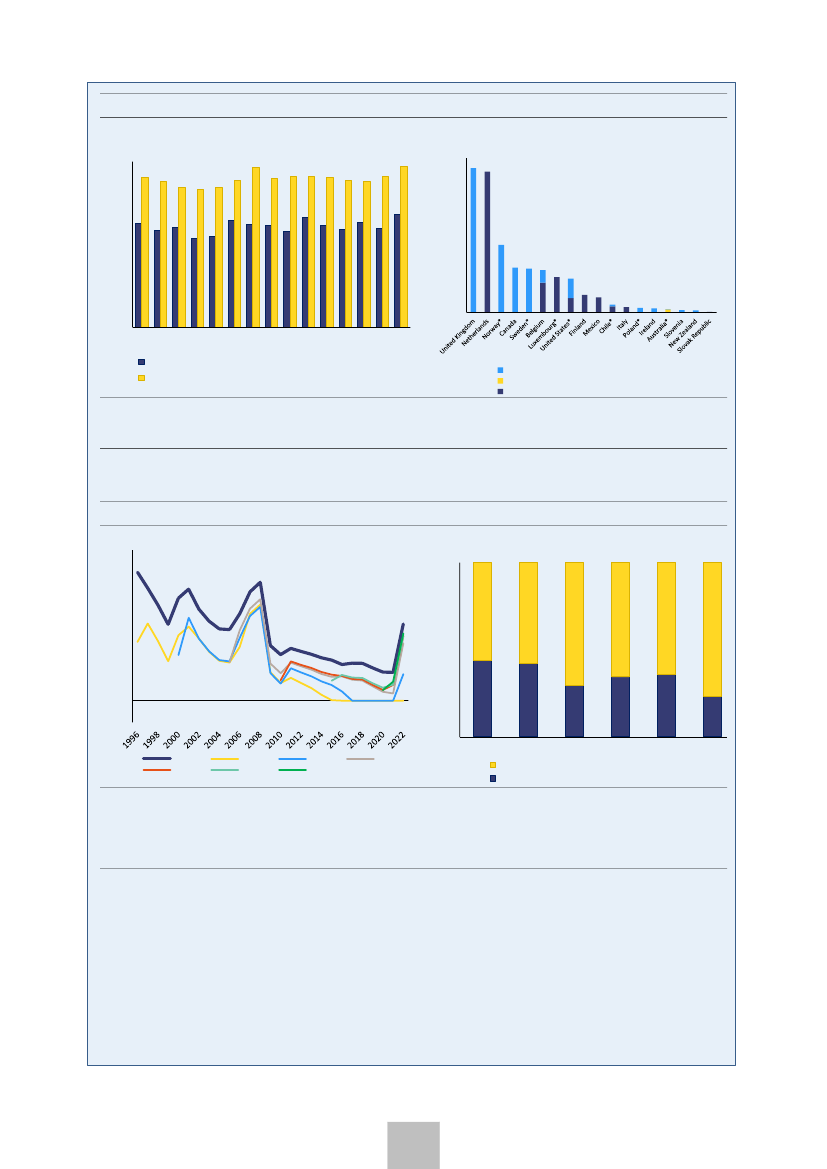
In addition, MITR primarily benefits high-income earners who can afford to purchase expensive
homes. This means that lower-income and middle-class families who may struggle to afford a
home do not benefit as much from this deduction (Andrews, Dan and Aida Caldera Sánchez
(2011)). The evolution of the share of owners with a mortgage (see Graph 2.4 a) in Luxembourg is
quite stable and also evidence that high-income families are more likely to have access to
mortgages. MITR in the case of Luxembourg is translated in a significant lower effective interest
rate (see Graph 2.5 a), in the case of high-income households, which raises households borrowing
constraints, driving up prices significantly. Finally, it can lead to a significant loss of revenue for the
government, as it reduces the amount of income tax that is collected (see Graph 2.4 b and 2.5 b).
13
kom (2023) 0600 - Ingen titel
2.
Assessment of macroeconomic vulnerabilities
Graph 2.4:
Share of owners and foregone tax revenue
a)Evolution of the share of owners with a mortgage
by income situation in relation to the risk of poverty
threshold
45
1.4%
1.2%
1.0%
b) Foregone tax revenue due to tax relief for
access to home ownership
30
0.8%
0.6%
15
0.4%
0.2%
0.0%
0
07 08 09 10 11 12 13 14 15 16 17 18 19 20 21
Households with less than 60% of median equivalized income
Households with more than 60% of median equivalized income
Other
One-off tax relief for first-home buyers
Tax relief for mortgage payments
graph b: OECD Affordable Housing Database, available in https://www.oecd.org/els/family/PH2-2-Tax-relief-for-home-
ownership.pdf (please check also for notes).
Source:
European Commission services
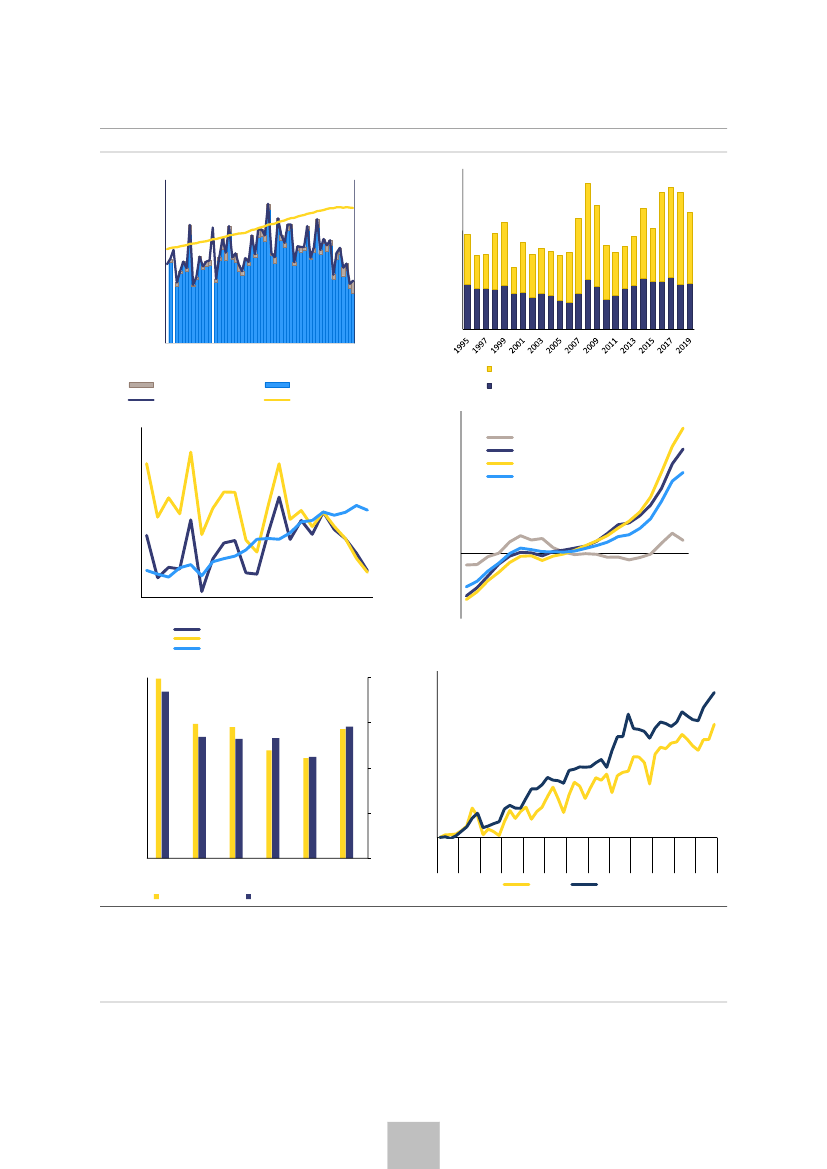
Graph 2.5:
Nominal interest rate
7
6
5
4
3
2
1
0
-1
0
Original
2010
1996
2015
2000
2020
2005
1996
2000
2005
2010
2015
2020
Share of interest not deducted from taxes (%)
Share of interest deducted from taxes (%)
25
50
a) Nominal interest rate supported after
considering mortgage interest tax reduction, for
selected years of first occupancy compared with
the original interest rate
100
b) Share of cumulated interest for selected years
of first occupancy
75
The value of the mortgage is the estimated as 100% LTV required to acquire a 100m2 dwelling, by back casting the
2022 price per square meter in 2022 (EUR 8901, source STATEC), max marginal income tax rate of 46.62%, 30 years
loan, family size equal to 4 persons. It is assumed that the occupancy in the first year of occupancy starts in beginning of
July, meaning that there are only 6 monthly payments.
Source:
ECB and European Commission services
For a significant share of potential house buyers their demand is determined by their access to
credit or borrowing capacity. The borrowing capacity of a household is the loan that a household
can repay using a share of their monthly income. It increases with income and decreases when the
interest rate rises. An increase in MITR its equivalent to a decrease in interest rates and therefore it
increases the borrowing capacity. Table 2.2 presents an illustrative scenario about how the change
in MITR implemented in 2023 affect the amount households can borrow to by property. It shows
that the increase in the MITR is equivalent to an increase in the borrowing capacity of 4.4% (see
Table 2.2). Conversely, a complete elimination of the MITR would translate into a decrease of the
amount that can be borrowed by 11.6%. These scenarios present an illustration of the possible
range of impacts that changes to the MITR can have on house prices.
14
kom (2023) 0600 - Ingen titel
2.
Assessment of macroeconomic vulnerabilities
Table 2.2:
Impact of different MITR policies in households borrowing capacity
MITR policy scenario
Interest
Supported
compensated by tax
interest
reduction
(euros)
(euros)
31324.7
27595.1
25730.3
Change in
Change in
Borrowing capacity with
borrowing
borrowing
constant income
capacity vs MITR capacity vs MITR
in 2022
in 2023
(euros)
(euros)
(2022 MITR policy = 100) (%)
(%)
0
16937.2
48262
92
-7.7
-11.6
3729.6
16937.2
44532.4
100
0
-4.2
5594.4
16937.2
42667.6
104
4.4
0
Loan
amortization
Sum of monthly
payments
MITR = 0
MITR = 2000 per person
MITR = 3000 per person
(1) The value of the mortgage is the estimated as 100% LTV required to acquire a 100m2 dwelling, considering the 2022
price per square meter in 2022 (EUR 8901, source STATEC), max marginal income tax rate of 46.62%, 30 years loan,
family size equal to 4 persons and the average mortgage interest rate in January 2023 (source ECB)..
Source:
European Commission services
References:
Andrews, Dan and Aida Caldera Sánchez (2011),
“The Evolution of Homeownership Rates in
Selected OECD Countries: Demographic and Public Policy Influences”,
OECD Journal: Economic
Studies, Vol. 2011/1.
OECD (2021),
Brick by Brick: Building Better Housing Policies,
OECD Publishing, Paris.
OECD (2022),
Affordable Housing Database.
OECD (2022),
Housing Taxation in OECD Countries,
OECD Tax Policy Studies, No. 29, OECD
Publishing, Paris,
Overall, a number of structural challenges remain to address the mentioned
vulnerabilities.
The fiscal treatment of housing tenure stimulates homeowner occupancy
especially via mortgage interest deductibility and other fiscal instruments supporting
homeownership. The recent planned reforms of the recurrent taxation of immovable property
based on up-to-date real estate valuations and measures increasing the opportunity costs of
unused land in urbanised areas and unoccupied dwellings are focused on supply-side restrictions.
These measures combine with ongoing reforms of spatial planning to accelerate a more efficient
land-use across the national territory, including measures involving municipalities in selectively
increasing residential density in areas well-connected to the transport network. Furthermore,
measures aiming to align housing supply and demand are more effective when integrated in
policies including local, regional, and national level. This strategy should ensure consistency with
complementary critical policy areas, such as transport and education, and their contribution to
social impact and environmental sustainability. Housing affordability has been deteriorating in
particular for low-income households that do not profit from subsidised social or affordable
housing. The increase in supply of social rental housing can reduce the affordability issue,
especially if access to it is made conditional on recurrent means testing ensuring better targeting to
those most in need. The functioning of the private rental sector can benefit from relaxing the rules
on renting parts of housing units and from conversion of existing dwellings into rental housing.
15
kom (2023) 0600 - Ingen titel
2.
Assessment of macroeconomic vulnerabilities
Conclusion
Luxembourg faces vulnerabilities relating to high house prices and high household
indebtedness.
Strong population growth pushed up the demand for housing in Luxembourg. The
supply of housing has not kept up with demand, restricted by the limited use of land available for
construction and the practice of land hoarding. The increasing gap between housing demand and
supply resulted in strong house price increases and deteriorating affordability of housing. Increases
in the price-to-income ratio mainly reflect high valuations of residential real estate, which rose
faster than incomes, leading to increasing financial risks related to household indebtedness. This
long-term price dynamics have led to an overvaluation in the housing market according to the
standard metrics. Affordability concerns have increased in the Luxembourg housing market, as
household debt in terms of disposable income continued trending upward and remains
substantially higher, compared to other Member States. Despite high household debt, the supply
shortage in Luxembourg’s housing market helped cushioning the turn of the financial cycle. Strong
fiscal position allowed the government to introduce measures to support households and firms and
stabilise the economy. Households’ financial assets are also high and because indebtedness
increases towards the higher levels of income and wealth, this mitigates the risks.
Significant policy measures have been adopted, which will contribute to addressing
vulnerabilities relating to housing debt and house prices in the medium term, but
structural challenges remain.
National authorities activated both capital and borrower-based
macroprudential measures with effect from 1 January 2021 to reduce mortgage credit related
financial risks. The measures adopted to increase the supply of housing, include tax reforms for
unused land and empty dwellings, the promotion of affordable and social housing, and the reform
of the rental market, which constitute a significant progress in addressing the housing market
issues. However, considering the current slowdown a step-up in efforts and prioritise their
implementation can stimulate housing supply more swiftly. The supply side fiscal measures can be
more effective in combination with the ongoing reform of land-use planning. Moreover, a reduction
or elimination over time of the mortgage interest rate tax deductibility, that was recently increased,
would reverse the current situation where fiscal policy subsidises indebtedness, increases
borrowing and stimulates demand and provide a windfall gain to home sellers. The structural
imbalance between housing demand and supply is expected to continue to drive up house prices in
the medium term. An increase in the supply of social rental housing and better targeted to the
most in need can alleviate the affordability issue. Lastly, a better collection of data in the real
estate market can improve the design of policies and to monitor their implementation.
Based on the findings in this in-depth review, the Communication “European Semester –
2023 Spring Package” sets out the Commission’s assessment as to the existence of
imbalances or excessive imbalances in Luxembourg, in line with Regulation 1176/2011.
(
35
)
(
35
) European Commission (2023), European Semester Spring Package 2022, COM(2023) 600 final.
16
kom (2023) 0600 - Ingen titel
2.
Assessment of macroeconomic vulnerabilities
Graph 2.6:
Selected graphs, Luxembourg
a) New loans to households for house purchase
1200
1000
millions EUR
4,000
50,000
3,000
b) Number of completed dwellings
40,000
800
30,000
600
20,000
400
200
0
19-01
20-01
21-01
22-01
23-01
2,000
1,000
10,000
0
0
Two and more dwelling residental buildings
One-dwelling residental buildings
Renegotiation
Total
140
Pure new loans
Outstanding amount (rhs)
100
d) Overvaluation metrics
Model-based valuations gap
Price to income vs. hist. avg.
Price to rent vs. hist. avg.
Overall valuation gap
c) Housing transactions
% deviation of current price
17Q4
18Q4
19Q4
20Q4
21Q4
22Q4
120
index (2021Q4 =100)
50
100
80
0
60
-50
02
04
06
08
10
12
14
16
18
20
22
Value of housing transactions
Number of housing transactions
Transaction price
1600000
12000
175
f) Advertised rent prices
e) Regional house prices
1200000
9000
150
800000
6000
125
400000
3000
100
0
C.Esch
C.Lux
Total
Nord
CM
Est
0
T1 T3 T1 T3 T1 T3 T1 T3 T1 T3 T1 T3 T1 T3 T1 T3 T1 T3 T1 T3 T1 T3 T1 T3 T1 T3
2010 2011 2012 2013 2014 2015 2016 2017 2018 2019 2020 2021 2022
House
Apartment
Houses (EUR)
Appartments (EUR/m2, rhs)
graph e Publicité Foncière, STATEC calculations - Habitat Observatory, transactions from January 1, 2022 to December
31, 2022; Note: C.Lux stands for the canton de Luxembourg, CM stands for the combined area of the cantons of Capellen
and Mersch, C.Esch stands for the canton d'Esch-sur-Alzette. The east zone corresponds to the cantons of Echternach,
Grevenmacher and Remich. Finally, the northern zone includes the cantons of Clervaux, Diekirch, Redange, Vianden and
Wiltz
Source:
Statec, Eurostat and European Commission services
17
kom (2023) 0600 - Ingen titel
2.
Assessment of macroeconomic vulnerabilities
Box 2: Inflation exposures and cross-border pass-through
This box sheds light on the sources of inflation in Luxembourg and its spill-overs with EU
partners.
The period since 2021 has been characterized by pandemic aftershocks and global
supply chain disruptions compounding global inflationary pressures and a surge in commodity
prices triggered by Russia’s war of aggression against Ukraine. As a result, inflation in Luxembourg
surged to unprecedented levels. In response, wages and profits also picked up across the EU, which
further added to price pressures in Luxembourg. With input-output data, domestic inflation can be
decomposed into the contributions from key cost factors. Taking into account some data
limitations, the framework can be used to attribute consumer and investment price changes to i)
extra-EU import price changes, which include both directly imported inflation and inflation passed
through from EU partners import costs ii) domestic unit labour cost changes iii) domestic unit profit
changes, including indirect taxation changes and iv) rest-of-EU value added price changes. (
36
)
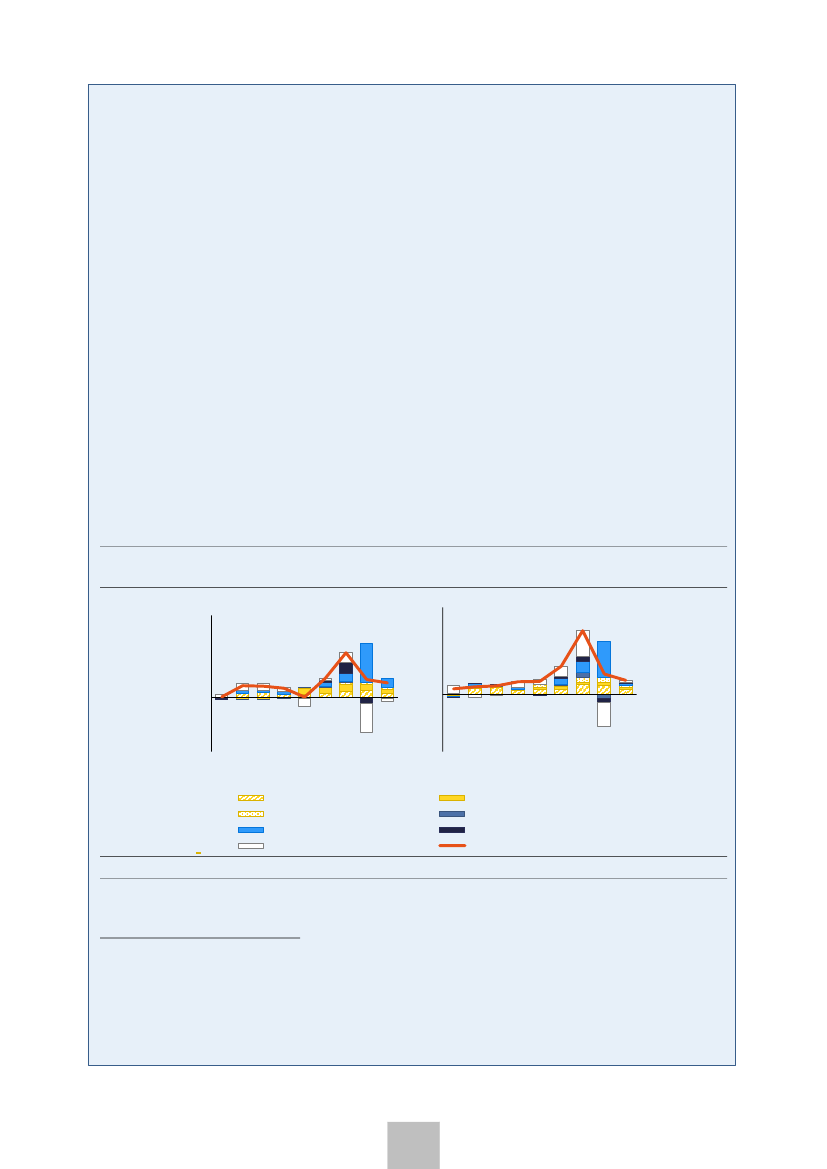
Data suggests that much of inflation in Luxembourg in 2022 reflected surging import
prices, which are projected to continue driving inflation over the forecast horizon.
In
2022, as shown in Graph 2.7, extra-EU price changes and costs passed through EU partners were a
key driver of consumption and investment inflation. Energy inflation contributed only mildly. Spill-
overs from value added inflation in other EU countries also remained limited. The contribution from
domestic value-added inflation, which covers wages and profits, was significant in 2022 and is
expected to remain sizeable in 2023 and 2024. This reflects increases in both, unit profits and unit
labour cost, with a slightly stronger impact from the latter. Still, consumer and investment inflation
is expected to be sustained mainly by non-energy imports from outside the EU. Value added
inflation in EU partners is also set to contribute somewhat, particularly to investment inflation.
Graph 2.7:
Components of gross fixed capital formation deflator growth and consumer price
inflation
15
LU: contribution to domestic CPI
deflator growth
15
LU: contribution to domestic GFCF
deflator growth
% change (year-on-year)
10
5
0
-5
-10
16
17
18
19
20
21
22
23
24
% change (year-on-year)
10
5
0
-5
-10
16
17
18
19
20
21
22
23
24
Domestic ULC
RoEU value added deflator
Other imports from Extra-EU
Residual
Unit profits (&taxes)
Energy imports from Extra-EU
RoEU import cost passthr.
Deflator growth YoY
Source:
European Commission services
(
36
) The graphs below are based on national accounts data and the Commission’s Spring 2023 forecast, which are combined
through a ‘Ghosh’ matrix based on Eurostat’s Figaro input-output available for 2015-2020. HICP is taken as the measure of
the price of private consumption, including non-residents. Energy import prices from extra-EU reflect realised median prices
until 2022, and energy price assumptions underlying the Spring forecast thereafter. Other goods prices reflect median
Eureopan prices per industry until 2022, and forecast non-energy goods and service trade prices for 2023-2024. Value
added deflators are assumed to affect all industries within a country to the same degree. For a similar analysis using an
input-output-based methodology, see “Inflation Differentials in Europe and Implications for Competitiveness: Thematic
Note to Support In-Depth Reviews” European Commission 2023, Institutional paper 198.
18
kom (2023) 0600 - Ingen titel
2.
Assessment of macroeconomic vulnerabilities
Table 2.3:
Selected economic and financial indicators (Part 1), Luxembourg
all variables y-o-y % change, unless otherwise stated
Real GDP
Potential growth (1)
Co ntrib utio n to GDP gro wth:
Domestic demand
Inventories
Net exports
Co ntrib utio n to po tential GDP gro wth (1):
Total Labour (hours)
Capital accumulation
Total factor productivity
Output gap (2)
Unemployment rate
Harmonised index of consumer prices (HICP)
GDP deflator
External position
Current account balance (% of GDP), balance of payments
Trade balance (% of GDP), balance of payments
Primary income balance (% of GDP)
Secondary income balance (% of GDP)
Current account explained by fundamentals (CA norm, % of GDP) (3)
Required current account to stabilise NIIP above -35% of GDP over 20Y (% of GDP) (4)
Capital account balance (% of GDP)
Net international investment position (% of GDP)
NENDI - NIIP excluding non-defaultable instruments (% of GDP) (5)
Net FDI flows (% of GDP)
Com petitiveness
Unit labour costs (ULC, whole economy)
Nominal compensation per employee
Labour productivity (real, hours worked)
Real effective exchange rate (ULC)
Real effective exchange rate (HICP)
Export performance vs. advanced countries (% change over 5 years)
Private sector debt
Private sector debt, consolidated (% of GDP)
Household debt, consolidated (% of GDP)
Household debt, fundamental benchmark (% of GDP) (6)
Household debt, prudential threshold (% of GDP) (6)
Non-financial corporate debt, consolidated (% of GDP)
Corporate debt, fundamental benchmark (% of GDP) (6)
Corporate debt, prudential threshold (% of GDP) (6)
Private credit flow, consolidated (% of GDP)
Corporations, net lending (+) or net borrowing (-) (% of GDP)
Households, net lending (+) or net borrowing (-) (% of GDP)
Net savings rate of households (% of net disposable income)
2003-07
4.7
3.9
1.8
0.3
2.5
1.9
1.3
0.7
1.1
4.4
3.0
3.7
6.9
28.7
-22.0
0.2
3.7
2.7
0.3
22.7
.
.
1.9
3.5
1.7
0.6
1.6
25.8
217.9
45.5
53.6
155.6
172.4
62.6
175.0
46.1
6.2
-0.1
5.5
2008-12
0.6
2.2
1.9
-0.1
-1.3
1.3
1.3
-0.3
-1.5
4.9
2.7
3.8
5.7
36.5
-30.6
-0.2
4.3
1.4
-0.4
12.1
.
.
4.3
2.2
-1.1
2.1
0.4
16.5
287.4
55.1
61.6
153.2
232.3
72.1
170.9
5.1
0.5
0.2
6.1
2013-18
2.6
2.2
1.4
0.2
1.0
1.6
1.0
-0.5
-0.8
6.0
1.1
2.7
4.7
40.6
-36.4
0.5
4.7
4.4
0.0
64.9
-3442.3
47.8
3.2
2.3
-0.1
1.5
0.6
17.8
298.9
60.5
69.2
169.3
238.4
79.0
183.6
13.3
-0.1
0.5
7.9
2019
2.3
2.2
2.7
0.1
-0.4
1.7
0.8
-0.3
-0.5
5.6
1.6
1.4
3.4
32.6
-29.5
0.3
5.1
4.8
-0.1
67.8
-4153.8
107.6
3.1
1.9
-0.8
1.0
-0.4
5.2
310.8
67.2
69.9
113.1
243.6
79.1
137.2
24.9
-5.8
1.1
8.3
2020
-0.8
1.9
-1.7
-0.3
1.2
1.4
0.7
-0.2
-3.2
6.8
0.0
4.7
3.2
32.7
-29.3
-0.3
5.2
4.6
-0.1
63.9
-4148.8
-32.2
3.8
1.2
3.4
-0.4
0.1
18.4
320.3
68.5
77.5
115.6
251.7
86.6
143.5
42.9
-0.4
6.1
19.1
2021
5.1
1.9
5.0
0.4
-0.3
1.4
0.8
-0.3
-0.1
5.3
3.5
6.2
4.6
34.7
-31.0
0.9
5.2
2.9
1.2
40.4
-4638.1
173.6
3.9
6.0
-2.0
3.5
0.8
19.0
340.6
66.0
77.0
100.6
274.6
85.0
126.5
53.9
0.7
2.8
12.4
2022
1.5
2.2
1.4
-0.1
0.2
1.9
0.7
-0.5
-0.8
4.6
8.2
6.4
5.0
28.4
-24.2
0.8
5.3
2.2
0.5
28.2
-3767.0
47.6
7.4
5.4
-2.3
3.6
-1.1
.
337.1
66.3
79.3
99.4
270.8
86.3
123.2
21.3e
1.8
2.8
.
forecast
2023
1.6
2.3
0.9
0.0
0.7
2.2
0.6
-0.5
-1.5
4.8
3.2
5.5
6.1
.
.
.
5.2
2.3
.
.
.
.
7.8
6.9
-1.8
1.9
.
.
.
.
.
.
.
.
.
.
4.6
3.8
.
2024
2.4
2.3
1.5
0.0
0.9
2.1
0.6
-0.4
-1.4
5.0
2.6
3.4
5.9
.
.
.
5.1
2.5
.
.
.
.
3.3
3.4
-0.9
-0.2
.
.
.
.
.
.
.
.
.
.
5.6
2.7
.
(e) estimate based on ECB quarterly data
(1) Potential output is the highest level of production that an economy can reach without generating inflationary
pressures. The methodology to compute the potential output is based on K. Havik, K. Mc Morrow, F. Orlandi, C. Planas, R.
Raciborski, W. Roeger, A. Rossi, A. Thum-Thysen, V. Vandermeulen, The Production Function Methodology for Calculating
Potential Growth Rates & Output Gaps, COM, European Economy, Economic Papers 535, November 2014.
(2) Deviation of actual output from potential output as % of potential GDP.
(3) Current accounts in line with fundamentals ("current account norms") are derived from reduced-form regressions
capturing the main determinants of the saving-investment balance, including fundamental determinants, policy factors
and global financial conditions. See L. Coutinho et al. (2018), "Methodologies for the assessment of current account
benchmarks", European Economy, Discussion Paper 86/2018, for details.
(4) This benchmark is defined as the average current account required to halve the gap between the NIIP and the
indicative MIP benchmark of -35% of GDP over the next ten years, or to stabilise the NIIP at the current level if it is
already above the indicative MIP benchmark. Calculations make use of Commission’s T+10 projections.
(5) NENDI is a subset of the NIIP that abstracts from its pure equity-related components, i.e. foreign direct investment
(FDI) equity and equity shares, and from intracompany cross-border FDI debt, and represents the NIIP excluding
instruments that cannot be subject to default.
(6) Fundamentals-based benchmarks are derived from regressions capturing the main determinants of credit growth and
taking into account a given initial stock of debt. Prudential thresholds represent the debt threshold beyond which the
probability of a banking crisis is relatively high, minimising the probability of missed crisis and that of false alerts.
Methodology to compute the fundamentals-based and the prudential benchmarks based on Bricongne, J. C., Coutinho, L.,
Turrini, A., Zeugner, S. (2019), “Is Private Debt Excessive?”, Open Economies Review, 1- 42.
Source:
Eurostat and ECB as of 2023-04-28, where available; European Commission for forecast figures (Spring forecast
2023)
19
kom (2023) 0600 - Ingen titel
2.
Assessment of macroeconomic vulnerabilities
Table 2.4:
Selected economic and financial indicators (Part 2), Luxembourg
all variables y-o-y % change, unless otherwise stated
Housing m arket
House price index, nominal
House price index, deflated
Overvaluation gap (%) (7)
Price-to-income overvaluation gap (%) (8)
Residential investment (% of GDP)
Governm ent debt
General government balance (% of GDP)
General government gross debt (% of GDP)
Banking sector
Return on equity (%)
Common Equity Tier 1 ratio
Gross non-performing debt (% of total debt instruments and total loans and advances) (9)
Gross non-performing loans (% of gross loans) (9)
Cost of borrowing for corporations (%)
Cost of borrowing for households for house purchase (%)
2003-07
10.9
8.2
-7.5
-10.4
3.1
1.0
7.9
.
.
.
.
4.0
3.9
2008-12
3.1
1.2
1.9
1.5
3.2
0.8
17.7
-1.1
15.9
0.2
.
2.8
2.6
2013-18
5.6
4.2
11.1
17.7
3.7
1.6
21.3
5.7
26.4
0.8
1.0
1.5
1.8
2019
10.1
8.3
26.9
37.5
4.0
2.2
22.4
4.4
21.1
0.5
0.6
1.4
1.4
2020
14.5
13.1
40.3
50.2
3.8
-3.4
24.5
3.0
22.0
0.6
0.7
1.3
1.3
2021
13.9
12.4
56.0
69.3
3.3
0.7
24.5
3.8
22.4
0.5
0.6
1.3
1.4
2022
9.6
3.8
62.6
80.7
3.2
0.2
24.6
.
.
.
0.7
3.1
3.1
forecast
2023
.
.
.
.
.
-1.7
25.9
.
.
.
.
.
.
2024
.
.
.
.
.
-1.5
27.0
.
.
.
.
.
.
(7) Unweighted average of price-to-income, price-to-rent and model valuation gaps. The model valuation gap is
estimated in a cointegration framework using a system of five fundamental variables; total population, real housing
stock, real disposable income per capita, real long-term interest rate and price deflator of final consumption expenditure,
based on Philiponnet, N., Turrini, A. (2017), "Assessing House Price Developments in the EU," European Economy -
Discussion Papers 2015 - 048, Directorate General Economic and Financial Affairs (DG ECFIN), European Commission.
Price-to-income and price-to-rent gaps are measured as the deviation to the long term average (from 1995 to the latest
available year).
(8) Price-to-income overvaluation gap measured as the deviation to the long term average (from 1995 to the latest
available year).
(9) Domestic banking groups and stand-alone banks, EU and non-EU foreign-controlled subsidiaries and EU and non-EU
foreign-controlled branches.
Source:
Eurostat and ECB as of 2023-04-28, where available; European Commission for forecast figures (Spring forecast
2023)
20